Week 3
Milestones
- Advanced Analytics: Integrate with popular data visualization libraries like Plotly or Matplotlib to generate interactive visualizations based on the user's queries.
- Handle cases for lower case or upper case in queries checking for a specific condition.
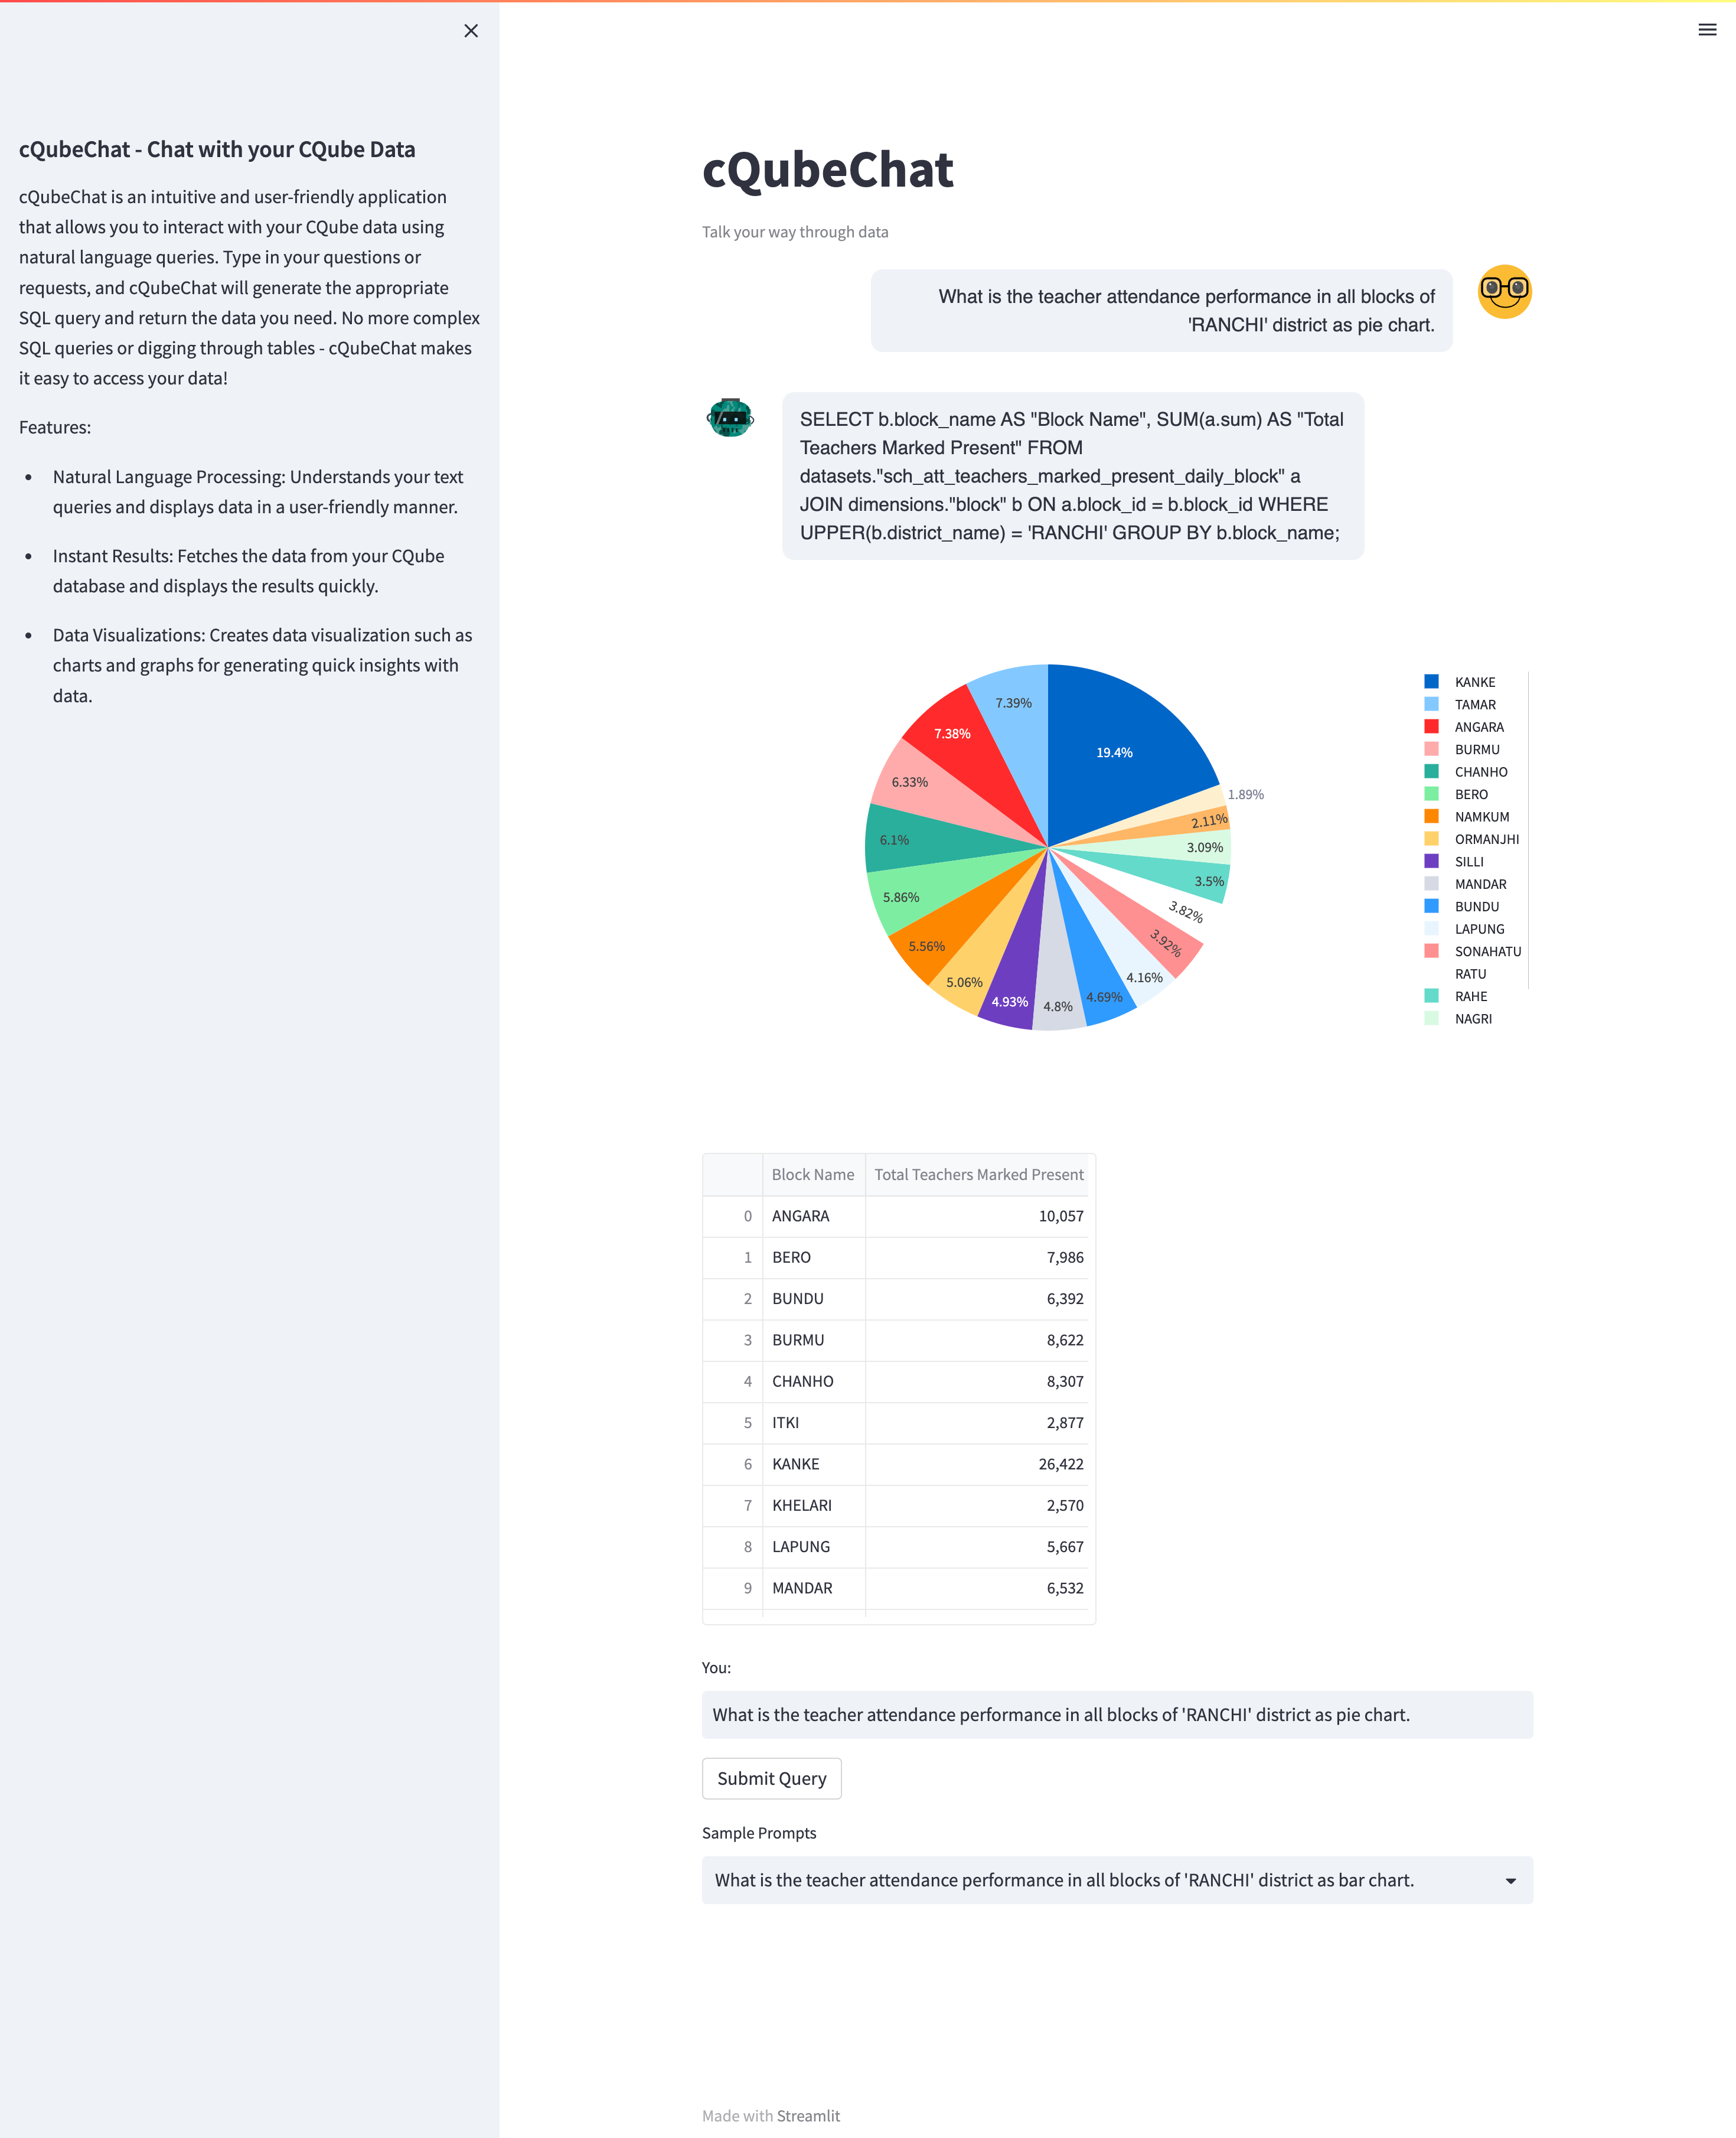
- Added support for pie chart
- Fix bar chart issues
Screenshots / Videos
Contributions
Learnings
- Bar chart in streamlit shows index column by default as xAxis labels, so we need to specifically mention the column for x-axis to handle this case.
- ChatGPT works better when you mention in the context for what purpose you want to use the query.